
2021 Tropical and Mid-Atlantic Outlook
The overall numbers are likely to be above average this year in terms of the number of tropical storms and hurricanes in the Atlantic Basin (includes the Caribbean Sea and Gulf of Mexico) with around 13 named tropical systems, 7 hurricanes, and 3 majors (i.e., category 3, 4 or 5 on the Saffir-Simpson Hurricane Wind Scale).
2021 Tropical Season and Summertime Outlook
Current sea surface temperature (SST) anomalies with La Nina (colder-than-normal) conditions across much of the tropical Pacific Ocean and warmer-than-normal water in parts of the tropical Atlantic Ocean. Map courtesy NOAA, tropicaltidbits.com
Overview
The number of named tropical storms this year is likely to be above-normal in the Atlantic Basin, but not as high as the very active 2020 tropical season. While the number of named tropical storms may be above-normal, the number that actually attain hurricane classification and “major” status (i.e., category 3 or higher) is likely to be right near normal. The average number of named storms in an Atlantic Basin tropical season is 12.1 with 6.4 of those reaching minimal hurricane status and 2.7 becoming “major”. Based on the overall analysis of current and forecasted conditions, I expect around 15 named storms in the Atlantic Basin this season with around 6 or 7 reaching hurricane status and of those perhaps 3 to achieve “major” classification level.
Two parameters factored into this year’s tropical outlook include the expected slight weakening of La Nina in the tropical Pacific Ocean and the warmer-than-normal sea surface temperatures in parts of the tropical Atlantic Ocean. The lack of an El Nino (i.e., warmer-than-normal water) in the tropical Pacific and the warmer-than-normal water in the “breeding ground” region of the tropical Atlantic tend to favor a more active tropical season in the Atlantic Basin compared to normal, but there will be some limiting factors compared to the extremely active 2020 season.
A list of names to be used for tropical storms/hurricanes in the 2021 Atlantic Basin tropical season. (Note – the Atlantic Basin includes the Caribbean Sea and Gulf of Mexico in addition to the Atlantic Ocean).
Slightly above the normal number of named tropical storms
Near normal number of hurricanes and “majors”
Slight weakening of La Nina in the equatorial Pacific Ocean
Warmer-than-normal water in parts of the tropical Atlantic
An analysis of “analog” years suggests the following:
quite warm and wet conditions for much of the eastern US
very hot and dry weather from Texas-to-California
likely a bad wildfire season in the western states
2020 Atlantic Basin tropical storm tracks and it was a record-breaking season in terms of the number of named systems (plot courtesy Wikipedia)
Recap of 2020 Atlantic Basin tropical season
The 2020 Atlantic hurricane season was the most active on record in terms of the number of named storms, but the accumulated cyclone energy (ACE) was tenth highest on record. Accumulated cyclone energy is a metric used to measure overall tropical activity by factoring in both the magnitude and duration of tropical cyclones. As it turned out, several of the tropical storms in last year’s season were rather weak and short-lived and with limited ACE. Specifically, the 2020 tropical season featured a whopping 30 named storms, but only 13 of those developed into minimal hurricane status and 6 further intensified into “major” classification status. In fact, the 2020 tropical season was so active in the Atlantic Basin, the Greek alphabet had to be used for the naming of storms for only the second time – the first being in 2005. It will, however, be the last time ever for the Greek alphabet to be utilized in the naming convention as the World Meteorological Organization has decided to no longer use these letters to avoid apparent confusion on the part of the public. Of the 30 named systems in 2020, 12 made landfall in the contiguous US which broke the record of nine set in 1916. Interestingly, while the Atlantic Basin featured an extremely active tropical season in 2020 in terms of the number of named storms, the much larger Pacific Ocean experienced its least active season since 2010.
Compilation of computer model forecasts for El Nino Southern Oscillation (ENSO) state for the rest of 2021 with most generating a slight weakening of La Nina in the tropical Pacific Ocean. The graph shows forecasts made by dynamical and statistical models for sea surface temperature (SST) anomalies in the Nino “3.4” region for nine overlapping 3-month periods. Plot courtesy International Research Institute/CPC, NOAA, ECMWF, JMA
La Nina conditions in the tropical Pacific Ocean
What goes on in the tropical Pacific Ocean does indeed have an effect on tropical activity in the Atlantic Ocean. El Nino, which refers to warmer-than-normal waters in the equatorial Pacific Ocean, affects global weather patterns and it tends to be an inhibiting factor for tropical storm formation/intensification in the Atlantic Basin. First, El Nino tends to produce faster-than-usual high-altitude winds over the tropical Atlantic Ocean and this increase in wind shear (change of wind speed with height) is hostile to the development or maintenance of tropical storms. In addition, El Nino tends to result in sinking motion over parts of the Atlantic Basin which also is hostile to tropical storm formation/intensification.
On the other hand, La Nina conditions in the equatorial part of the Pacific Ocean usually correlates with weaker wind shear over the breeding grounds of the tropical Atlantic Ocean and this leads to a more favorable environment for the development/intensification of tropical activity. La Nina formed last spring and then intensified going into the winter season of 2020-2021. Numerous computer models forecast a transition of a moderately strong La Nina this spring to a weak La Nina in the summer and they generally tend to continue this same type of sea surface temperature pattern into the fall.
The North American Multi-Model Ensemble (NMME) forecast map of sea surface temperature anomalies is shown for the August/September/October 2021 time period. The North American Multi-Model Ensemble is a multi-model, seasonal forecasting system consisting of coupled models from North American modeling centers. Map courtesy NOAA, tropicaltidbits.com
Favorable sea surface temperatures in parts of the Atlantic Basin
Not only are Pacific Ocean sea surface temperatures important in terms of its potential impact on tropical activity in the Atlantic Basin, but Atlantic Ocean water temperatures are crucial and play more of a direct role in the prospects for formation/intensification of tropical storms. Sea surface temperatures of >80°F are generally considered to be a necessary condition for the formation of tropical storms in the Atlantic Basin. As a result, above-normal sea surface temperatures are more favorable for the formation and intensification of tropical storms as waves trek westward over the tropical Atlantic from western Africa.
Indeed, the waters in much of the tropical Atlantic are warmer-than-normal as we close in on tropical season and they are as well in parts of the Gulf of Mexico and Caribbean Sea. Signs point to these sea surface temperature anomaly patterns continuing during the next several months – quite favorable for the formation/intensification of tropical storm activity in the Atlantic Basin. The pockets of warmer-than-normal sea surface temperatures near the southern and eastern US coastlines make this part of the nation quite vulnerable to tropical hits this season; especially, when “home-grown” systems tend to dominate. (What I refer to as “home-grown” systems are those which form over the Gulf of Mexico or the far western Atlantic Ocean as compared with those that travel westward from western Africa and towards the US). These “home-grown” type systems generally tend to dominate during the latter stages of an Atlantic Basin tropical season.
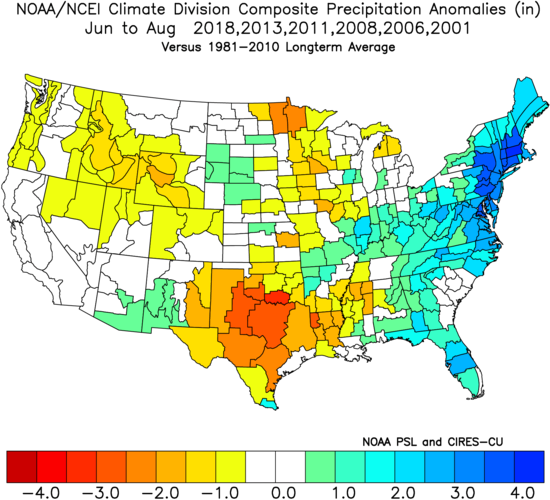
The six analog years that I have selected based on comparison with sea surface temperature anomaly patterns featured warmer-than-normal conditions across much of the nation (top plot) with an especially hot summer season from Texas-to-California. In terms of precipitation, wetter-than-normal weather took place across much of the eastern US during these analog years and it was drier-than-normal in much of the western half of the nation (bottom plot). Maps courtesy NOAA
Signals from the Analog Years and the Summertime Outlook
Based largely upon the expectation of weakening La Nina conditions later this summer and fall, there are six analog years that I have selected which featured similar sea surface temperature anomalies and trends. When averaged together, these six analog years featured slightly above-normal tropical activity in the Atlantic Basin in terms of the number of named storms and nearly the normal amount of those that reached minimal hurricanes status and “major” classification. The six analog years listed here include the number of named storms, number of minimal hurricanes, and the number of “major” hurricanes in each given year: 2018 (15/8/2), 2013 (13/2/0), 2011 (19/7/4), 2008 (16/8/5), 2006 (10/5/2) and 2001 (15/9/4).
In the Mid-Atlantic region, these six analog years generally featured warmer-than-normal conditions in the June through August time frame. Specifically, in terms of temperature anomalies, I expect the summer season to average from 1.0-3.0 (°F) above normal in the Mid-Atlantic region. Elsewhere, there is reason to believe that much of the nation will experience warmer-than-normal conditions this summer based upon comparisons with these selected analog years with the south-central states potentially extremely hot (e.g., Texas).

As of early April, drought conditions are generally non-existent in most of the eastern half of the nation, but are “extreme” in much of the Southwest US. Map courtesy NOAA
While I do support the idea of a warmer-than-normal summer in the Mid-Atlantic region, I believe that given the nearly normal soil moisture levels at the current time, it is likely to not turn out to be an excessively hot summer. The nearly normal soil moisture content across the eastern US is due in part to copious amounts of melted snow from this past winter; especially, to the north of the Pennsylvania/Maryland border. Excessively hot summers are much more likely when drought conditions are “severe” or “extreme” and this is currently not the case in the Mid-Atlantic or much of the eastern half of the nation.
On the other hand, the Southwest US and south-central states are currently experiencing widespread “extreme” drought conditions and this could very well contribute to an excessively hot summer in that part of the nation. In terms of precipitation, the Mid-Atlantic region will likely experience wetter-than-normal conditions this summer on the order of 2.0-4.0 inches above-normal based on comparisons with the analog years as will much of the eastern third of the nation. Elsewhere, the western half of the US is likely to see a continuation of its recent overall dry weather pattern and this will only exacerbate the “extreme” drought conditions.
Meteorologist Paul Dorian
Perspecta, Inc.
perspectaweather.com
2021 Tropical Season and Summertime Outlook